Performance
In-Game Profiling
Recognize performance issues live and straight in your game instance
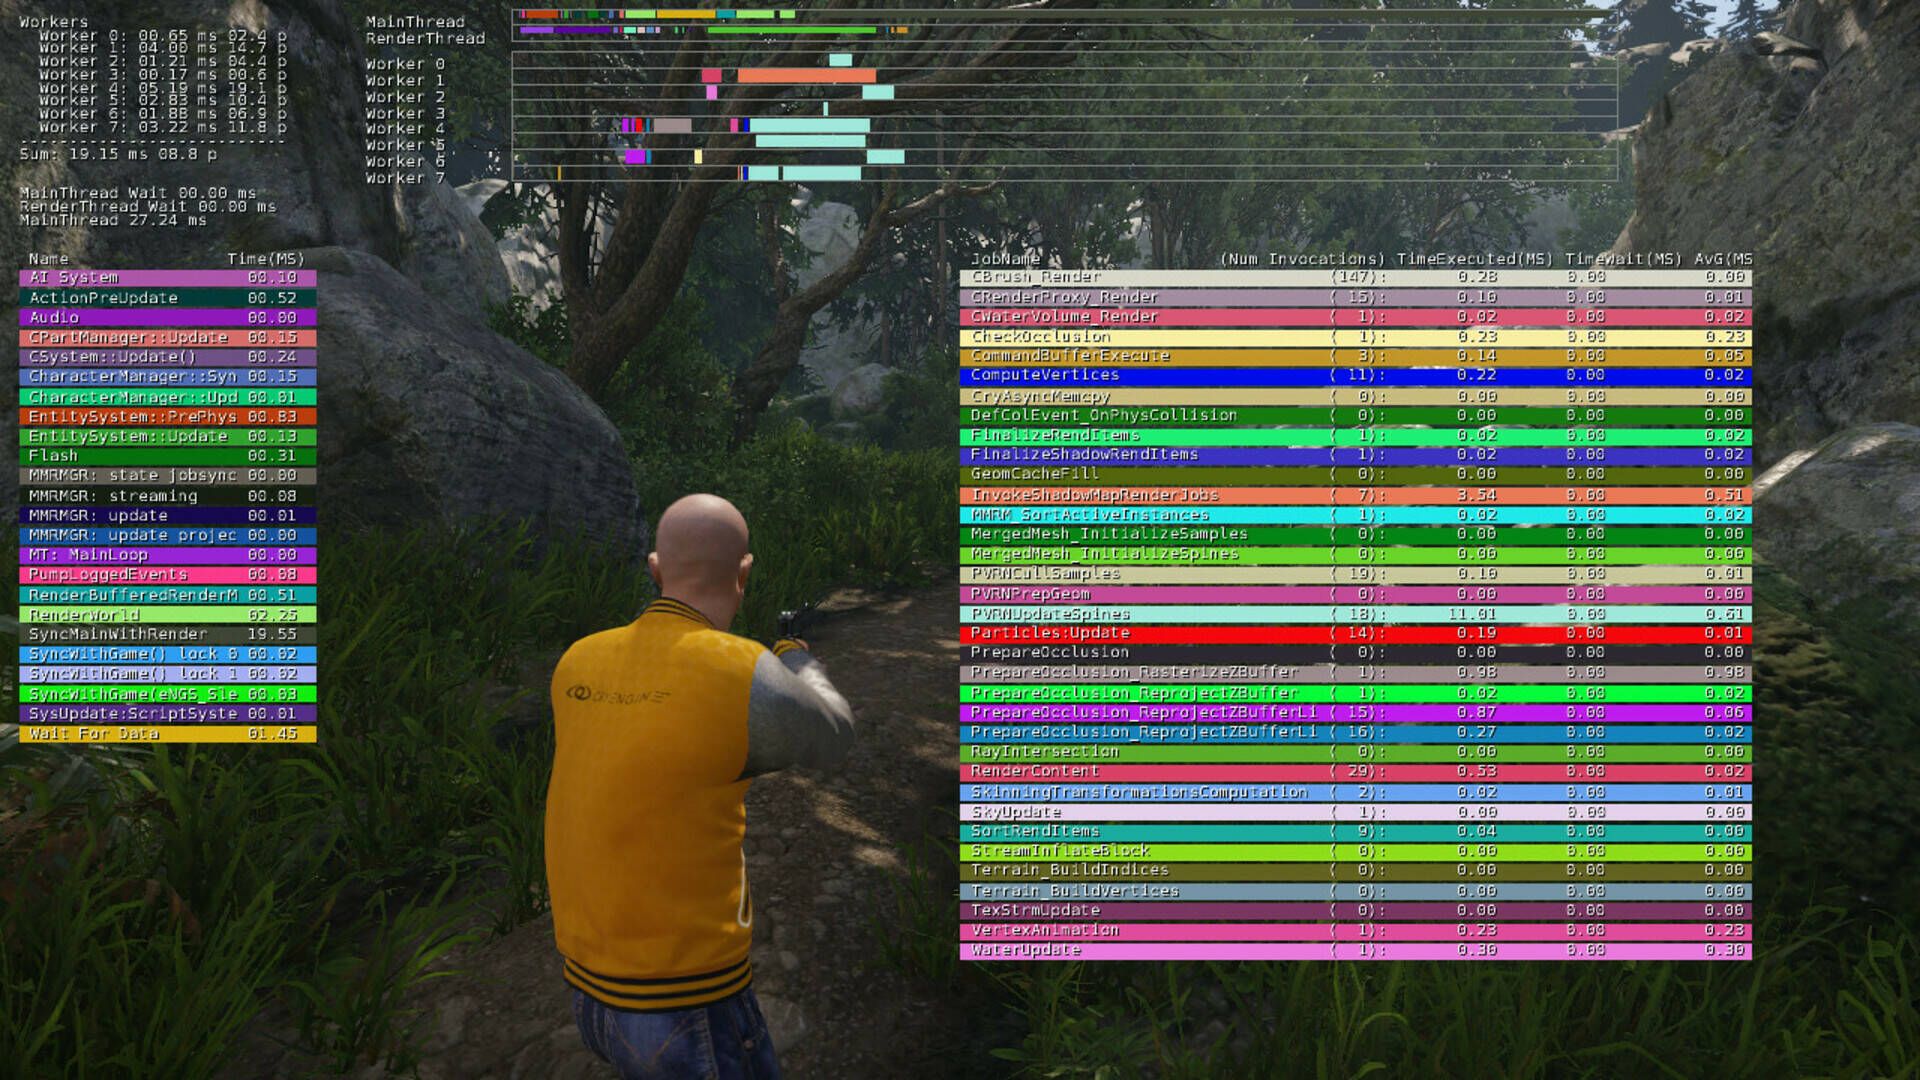
CRYENGINE is armed with profile labels all over the place. Take advantage of in-game profiling to immediately pinpoint performance issues when and where they occur.
Profile labels follow a hierarchy which reveals instantly what modules and functions are involved. Further, reliable information about duration and occurrence quickly help evaluating their impact. Distinguish at a glance if performance is limited by CPU or GPU and reveal the culprit on a high level.
Data-Driven thread management
Be ready for scalable hardware by utilizing an advanced thread management system
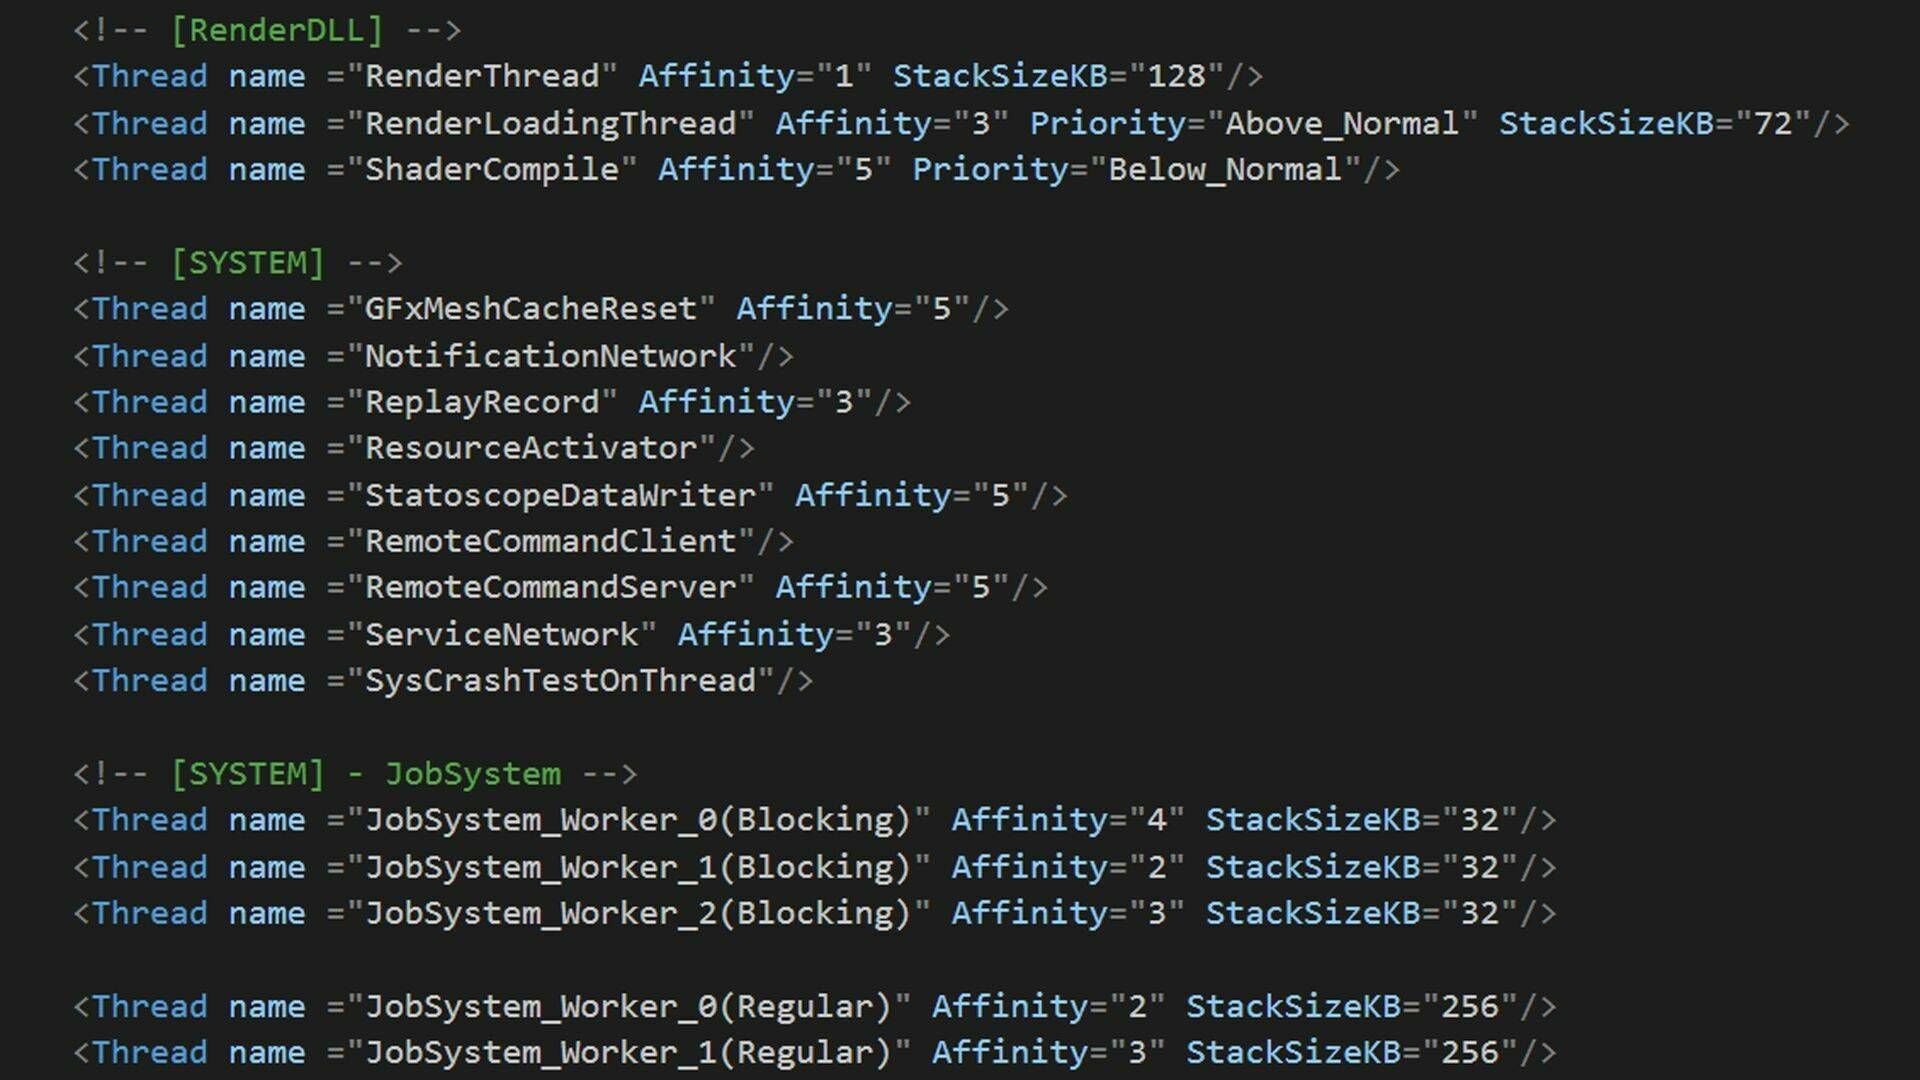
CRYENGINE’s platform-independent threading system pulls the strings for efficient work distribution across software and hardware threads. One central place for thread creation allows you to schedule and monitor parallel computation at runtime.
Threading is essential for real-time applications to fully exploit multi-core hardware. With CRYENGINE, you are in control of every single thread spawned by your process. Tweak individual thread characteristics to your specific project needs to achieve maximum performance.
Statoscope
Pinpoint performance issues with a detailed overview of exactly how your game is running
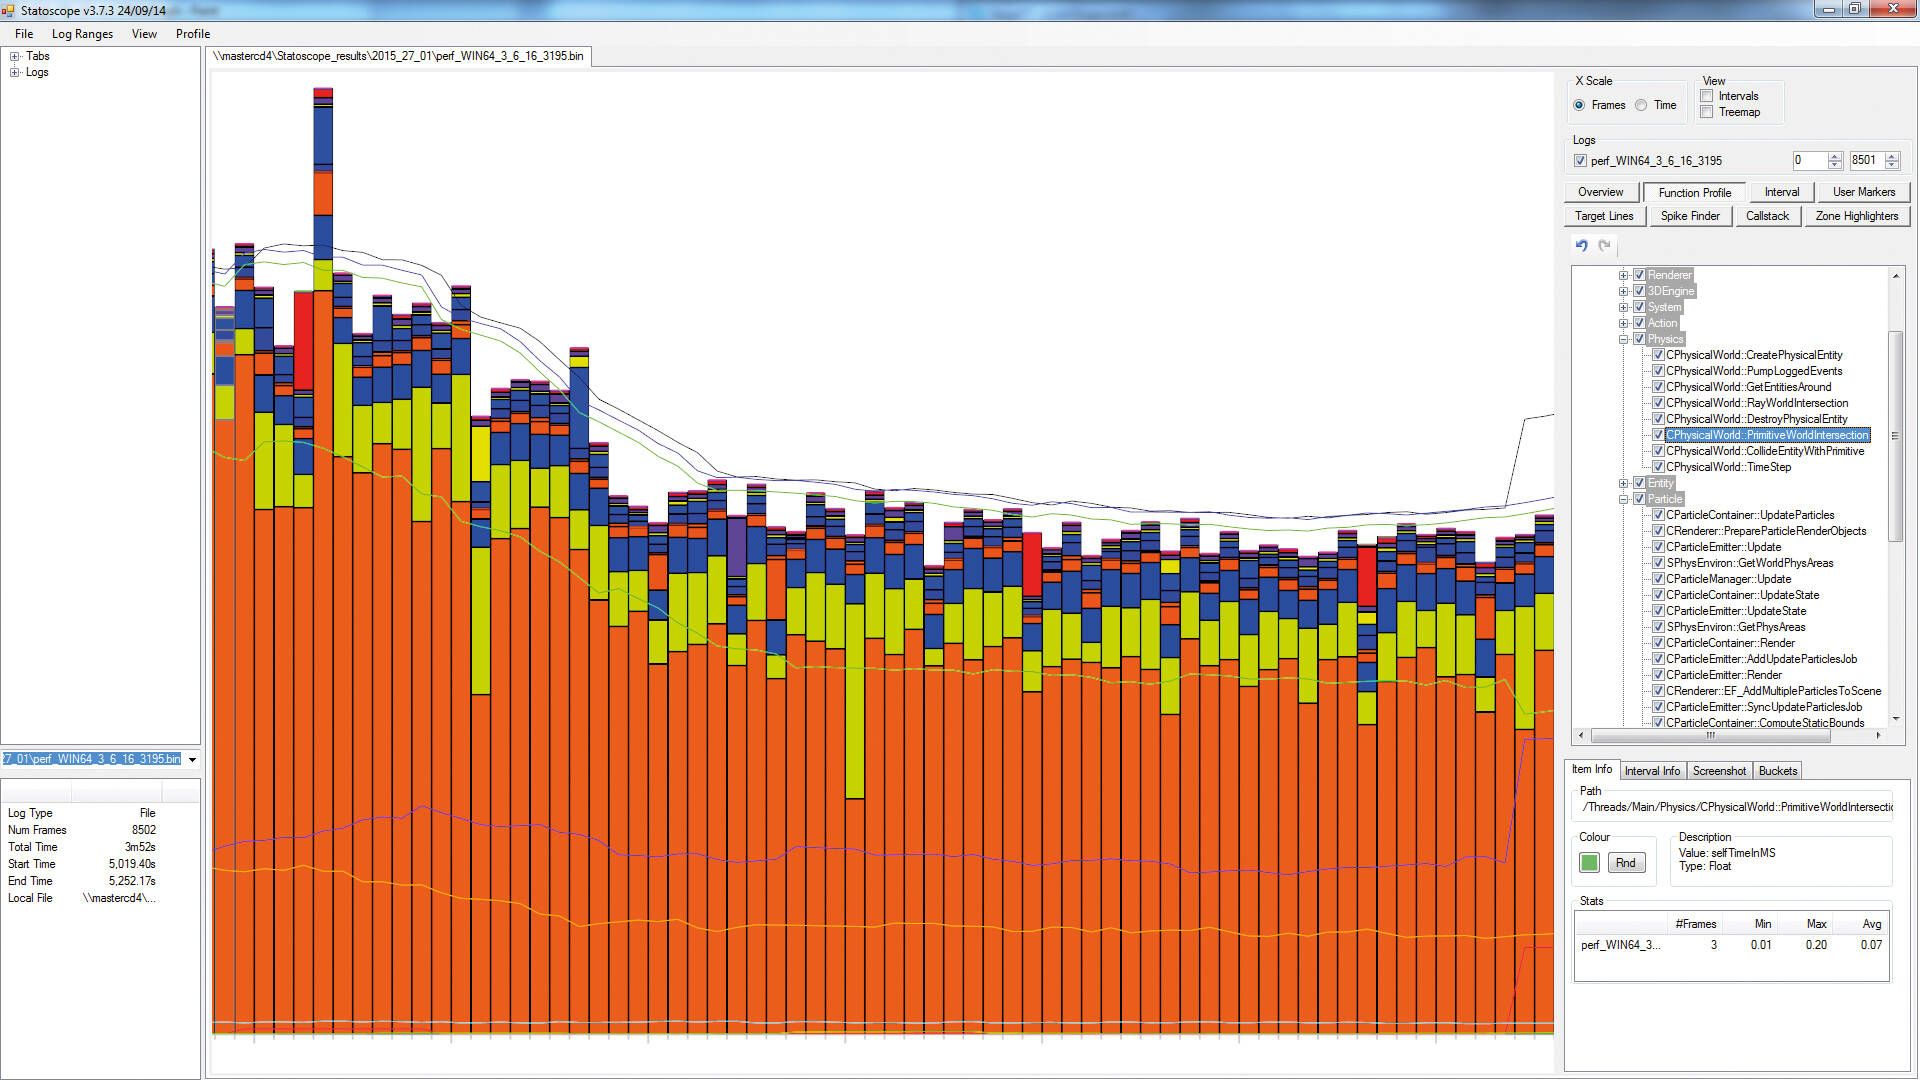
CRYENGINE’s powerful in-house diagnostic tool Statoscope is used to access information on where the engine performance is being spent. Through the addition of data groups into Statoscope, the user can expose CRYENGINE features to logically display the statistics on a per-frame basis in an external tool.
Either collect the data with a live feed directly from CRYENGINE into Statoscope, or log the information to file and read later. Additionally, users can overlay two capture sessions on top of each other to run a comparison of any changes made between the two runs.
Learn more with our Statoscope Documentation.


